
01 / Draw
Start with a rectangle.
Anywhere the data reaches.
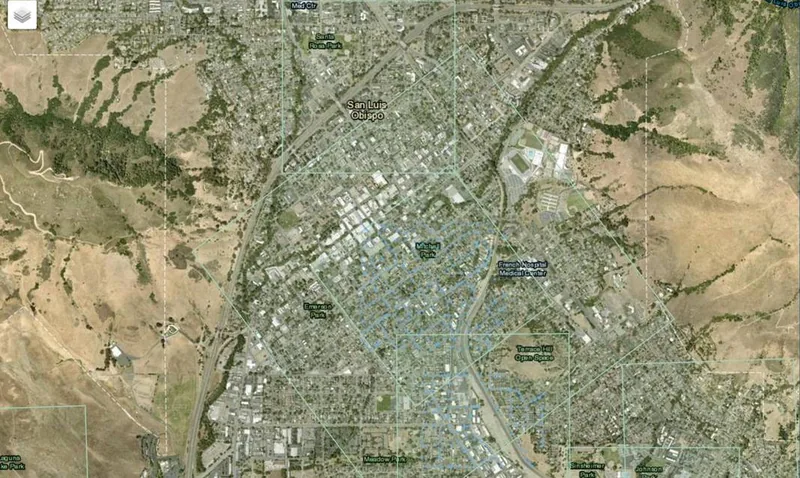
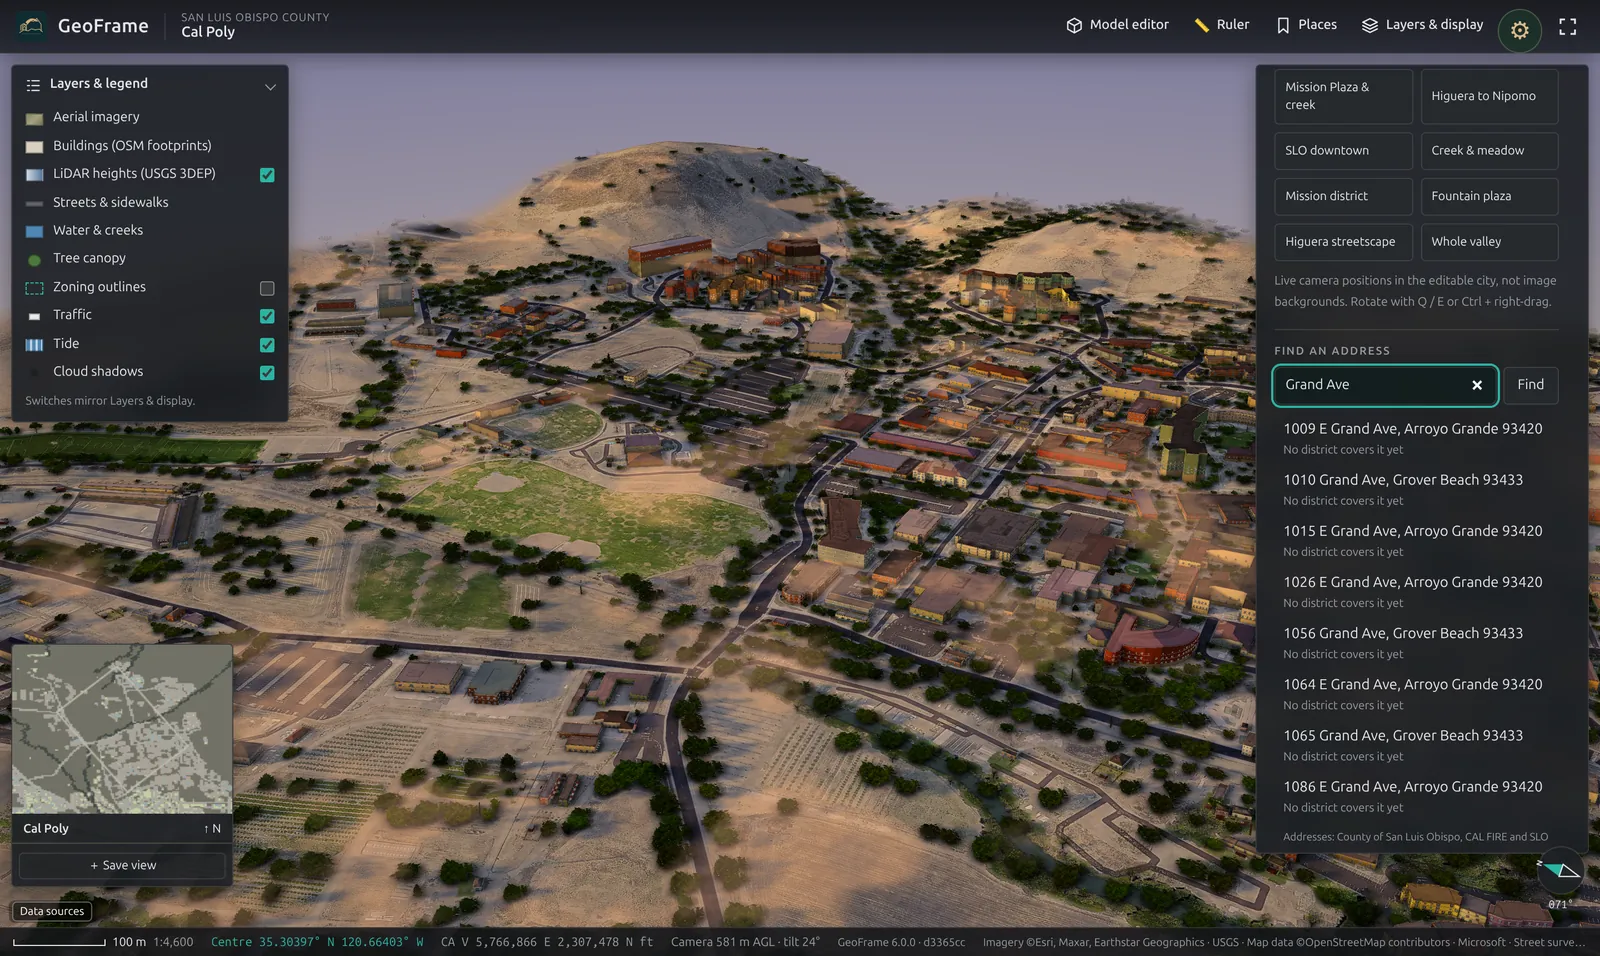
Search an address or pan the map, then drag a district from 500 m to 2 km a side. GeoFrame snaps it to the street grid.
GeoFrame / the place and the plan, side by side
GeoFrame builds a measured 3D model of any neighborhood from LiDAR, footprints, streets, trees and water, then puts your project in it. All in a browser.
HOW GEOFRAME WORKS
You choose the ground; GeoFrame does the modelling. It turns the square you select into a measured 3D model of the terrain and everything standing on it, built from public data with nothing traced by hand.
Drag a square on the map anywhere the public data reaches, from 500 m to 2 km a side. Ask for up to 64 of them, 256 km², in one request.
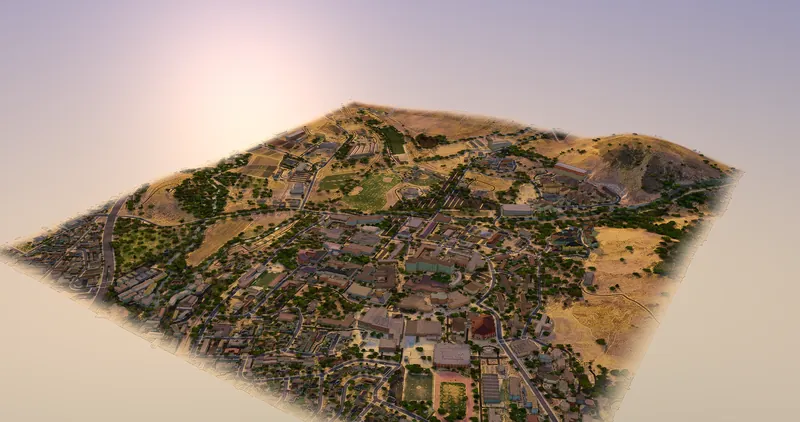
USGS LiDAR becomes real terrain: hills, valleys, creeks and coastline. Buildings rise to their measured heights, with streets, trees and water laid on top.
Fly over it, drop to street level, turn the sun and measure, all in the browser. Bring in your own CAD in 10 formats, and export images, video or a .glb model.
WATCH A DISTRICT GET MADE
01 / Draw
Search an address or pan the map, then drag a district from 500 m to 2 km a side. GeoFrame snaps it to the street grid.
02 / Build
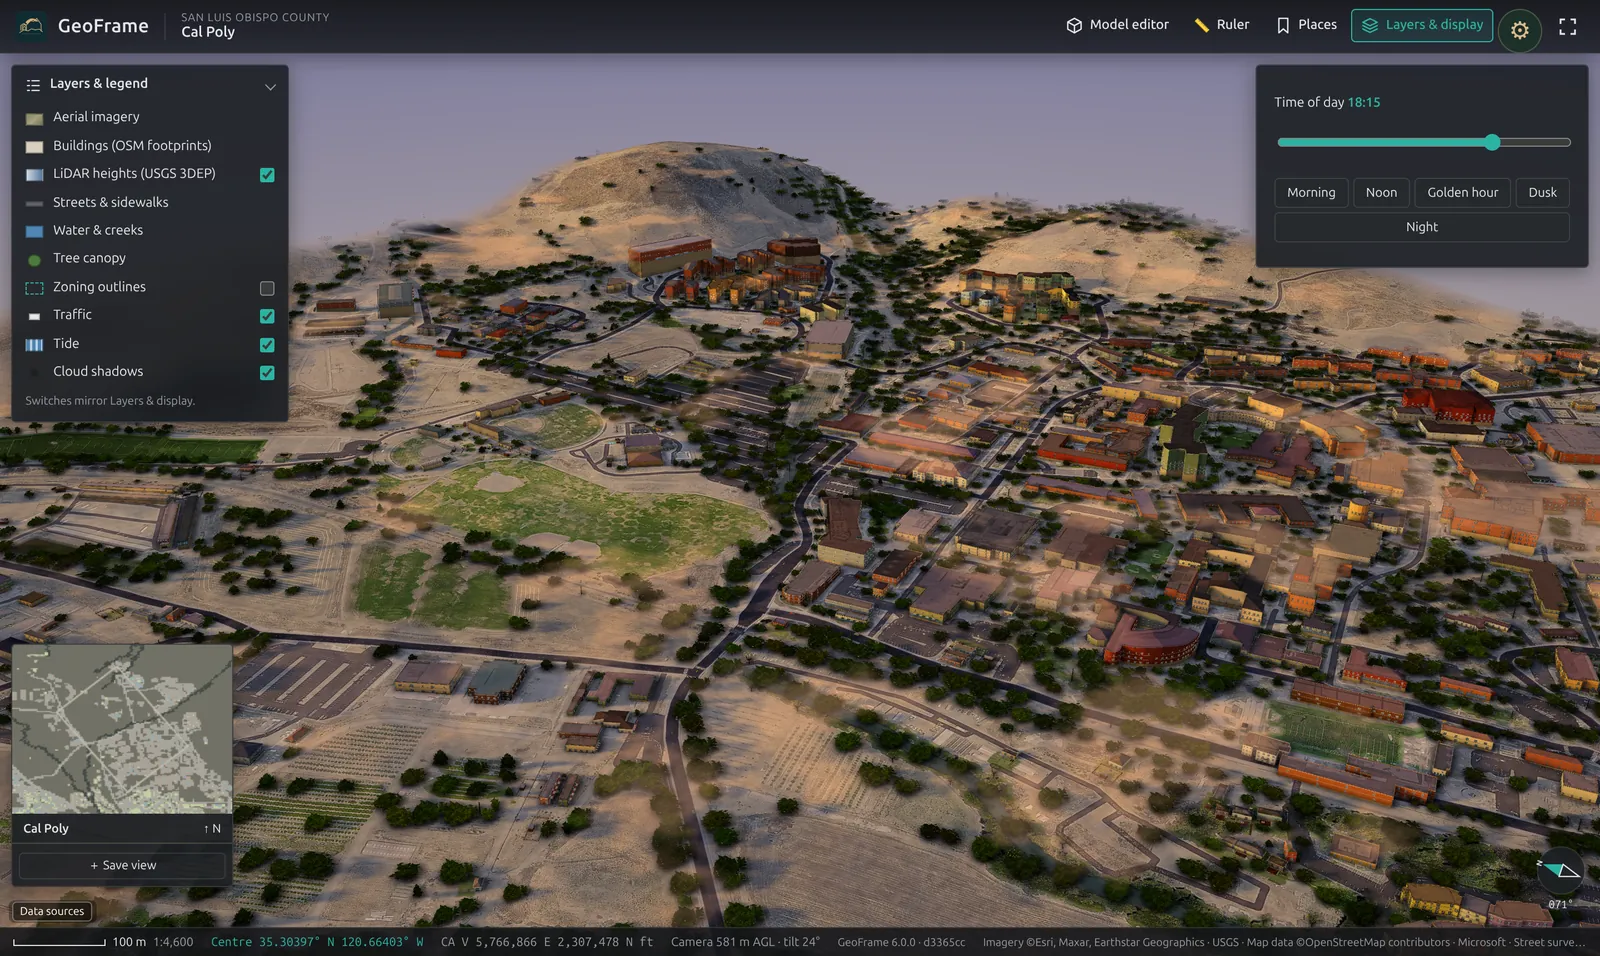
USGS LiDAR terrain and heights, building footprints, streets, tree canopy, water and parcels, assembled into one model.
03 / Study
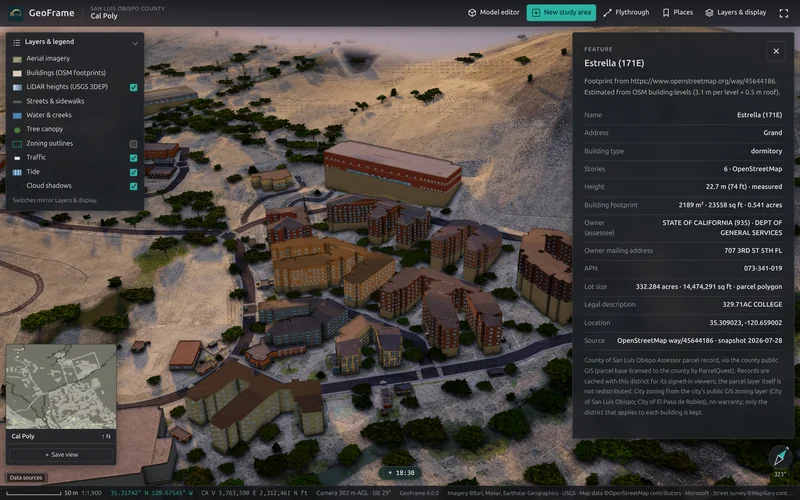
Scrub from morning to dusk, measure, and check what a project does to its street before anyone draws a line.
04 / Create
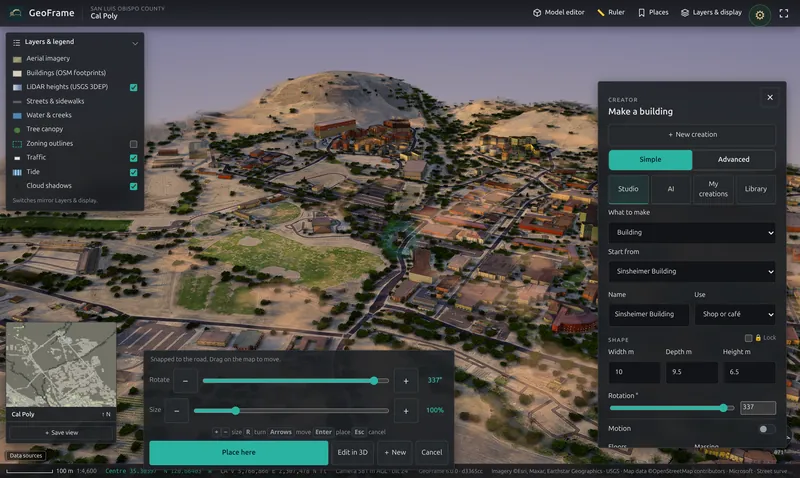
Width, depth, floors and use, or the full 3D editor with roofs, work planes and snapping.
01 / Share
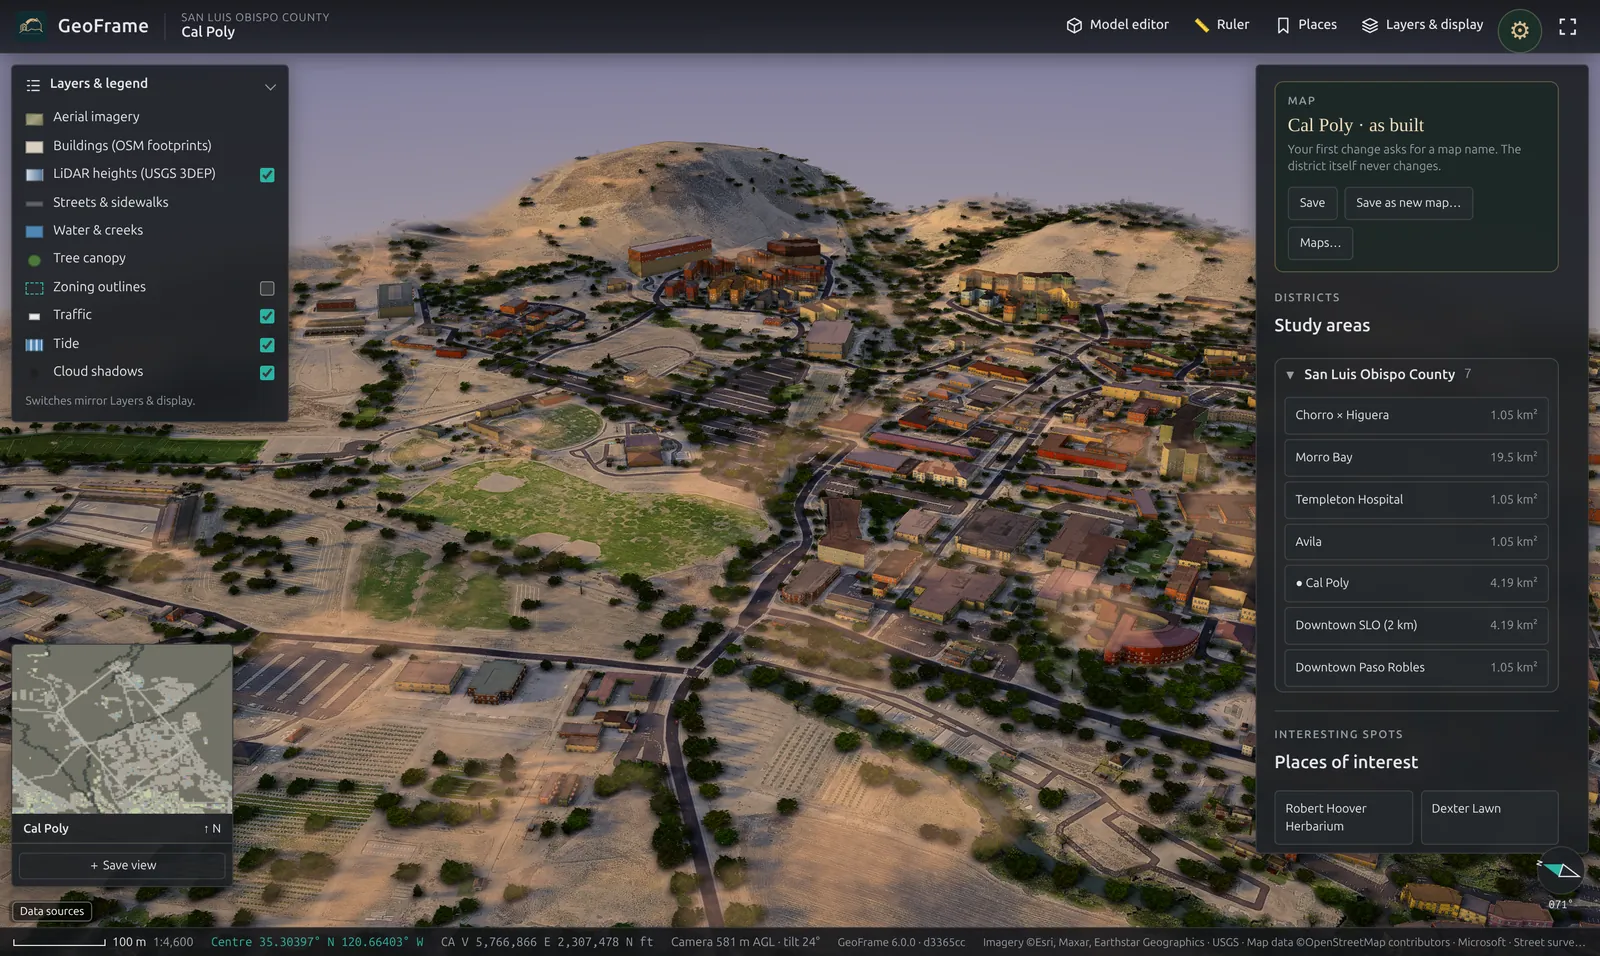
Your edits go into a named map. Share a link that opens straight into the scene for the client, the team or the public meeting.
02 / Present
Desktop, iPad or phone. Every clip on this page is the app running live, not a render.
03 / Deploy
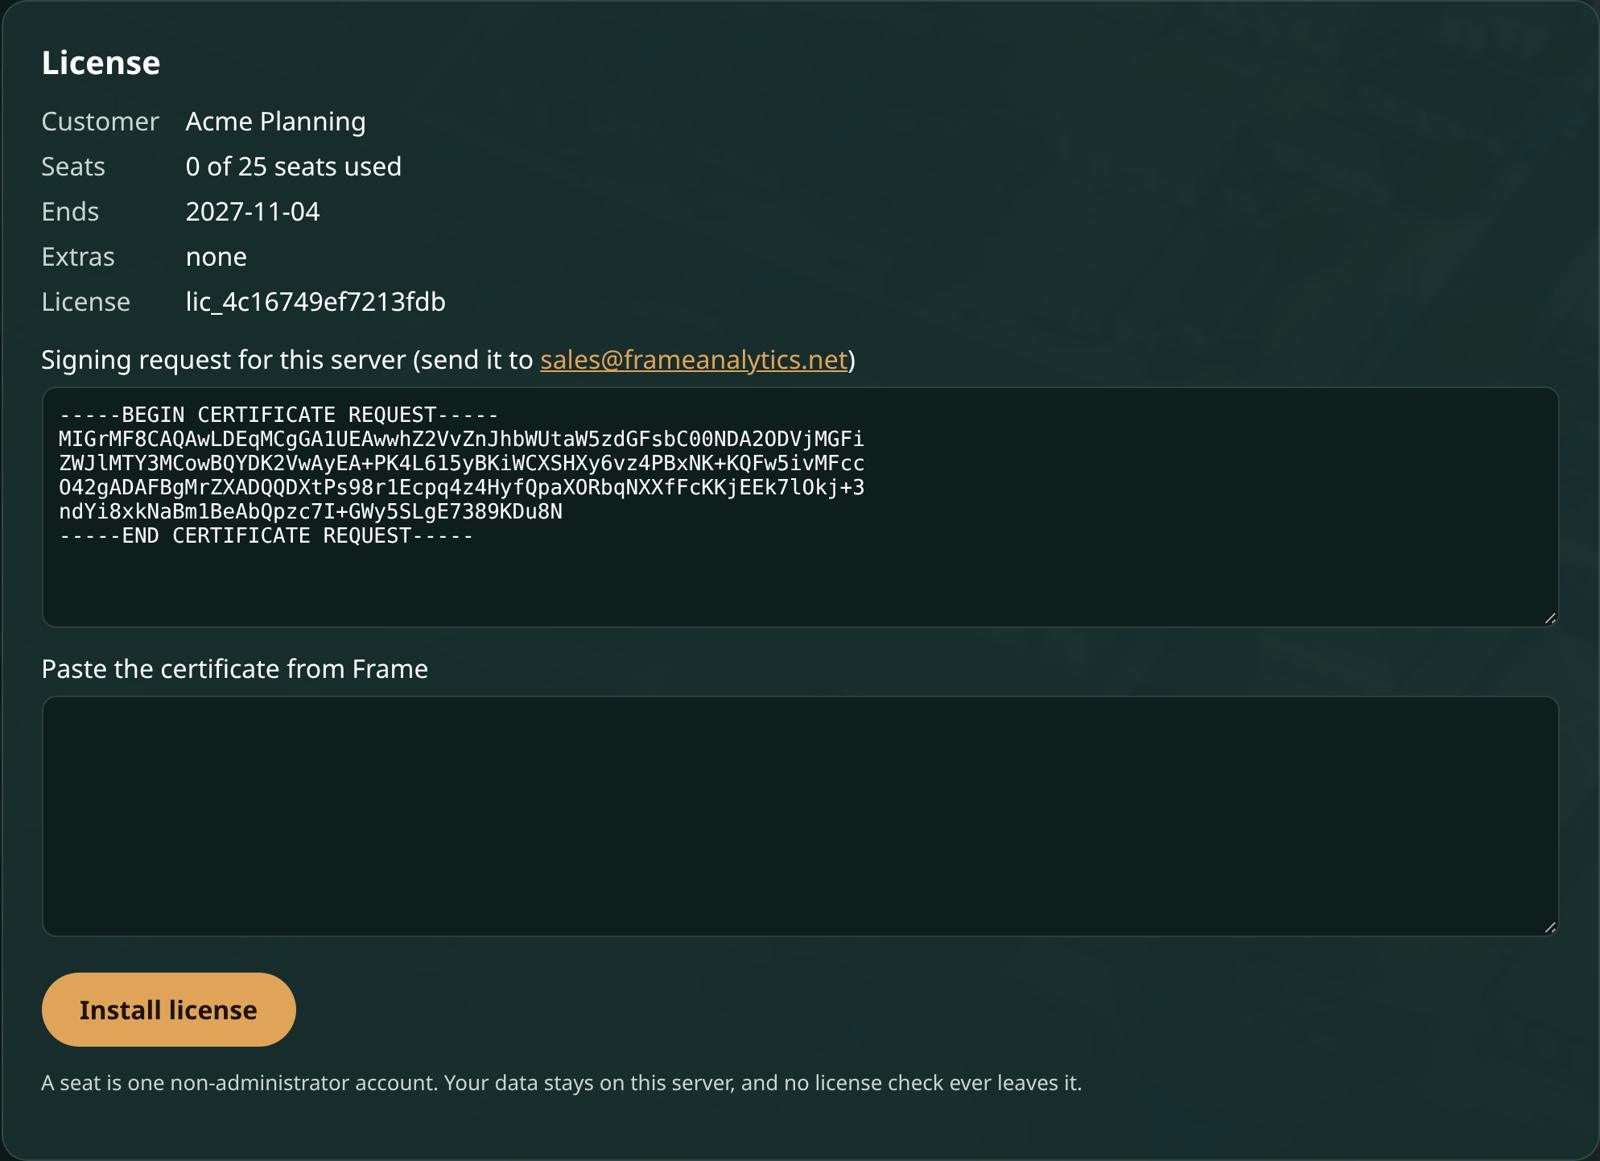
Run GeoFrame on premises with a license for your own server, or let us host it for a team, a city or a whole agency.
Pricing
Unlimited open-data areas, Creator, exports and share links.
TEAM$299a month for 5 seatsShared areas, client links and admin limits.
PROJECT PASS$499per projectOne site, the whole project team, no subscription.
GOVERNMENTfrom $6,000a year, hostedUnlimited staff seats. 90-day pilot available.